L’Egypte vue par Sentinel-1 Egypt seen by Sentinel-1 2D_stack
Nouveaux algorithmes avancés
pour la surveillance des terres et mer
New advanced algorithms to monitor land and sea
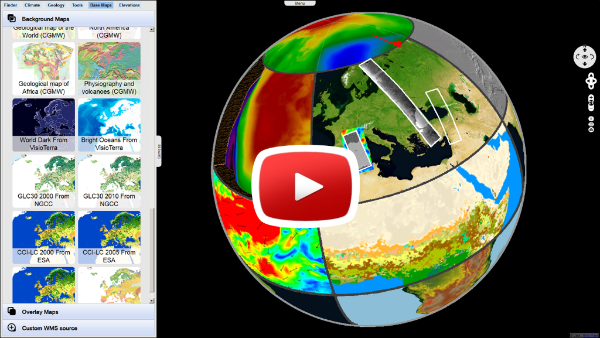
VisioTerra développe la plateforme VtWeb depuis plus de 6 années pour offrir l’accès à une grande variété de données gratuites : observation de la Terre, météorologie, climat, biogéophysique. VtWeb est en accès libre et permet à VisioTerra de développer rapidement des solutions sur mesure : portails hébergés ou infrastructures.
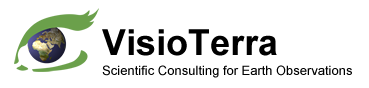
Les images en figures 1 et 2 montrent l’un des tous deniers algorithmes développés par VisioTerra. Ce traitement spécifique permet d’égaliser le coefficient de rétrodiffusion sigma0 en partie maritime.
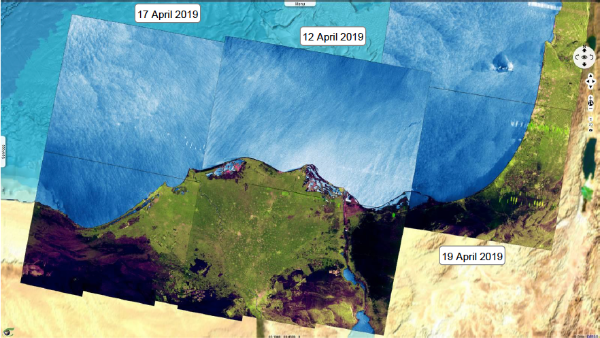
La fig.2 montre la complémentarité des images radar (à gauche) et optique (à droite) dans l’étude et la surveillance de la partie continentale. Nous présentons ici une vue aux alentours du NARSS (National Authority for Remote Sensing & Space Sciences) situé près de l’aéroport du Caire.
VisioTerra has been developing a VtWeb platform for more than 6 years capable of accessing a large number of free Earth observation, meteorological, climatic and biogeophysical data. VtWeb is open access and allows VisioTerra to quickly develop customized infrastructure solutions.
The images in Figures 1 and 2 show ones of the latest algorithms developed by VisioTerra. Specific processing in the maritime part makes it possible to equalize the coefficient sigma0 of radar backscatter.
Figure 2 shows the complementarity of the radar (left) and optical (right) images in the study and monitoring of the continental parts. Here, we present a view around the NARSS (National Authority for Remote Sensing & Space Sciences) located near the Cairo airport.
Fig.1: Trois acquisitions successives de Sentinel-1 (radar). vue_2Dvue_3D Fig.1: Three successive acquisition of Sentinel-1 (radar).2D_view3D_view
Fig.2: NARSS au Caire - S1B radar du 12.04.2019 (gauche) vs. S2A du 15.03.2019 (droite). gauchedroiteanimation_2D Fig.2: NARSS in Cairo - S1B radar on 12.04.2019 (left) vs. S2A on 15.03.2019 (right). 2D_left2D_right2D_animation
Surveillance des oil spills / oil seepages
en utilisant les données Sentinel-1 (radar)
couplées avec les courants et vents de surface
Monitoring oil spills / oil seepages by using Sentinel-1 (radar) data
coupled with surface currents and winds
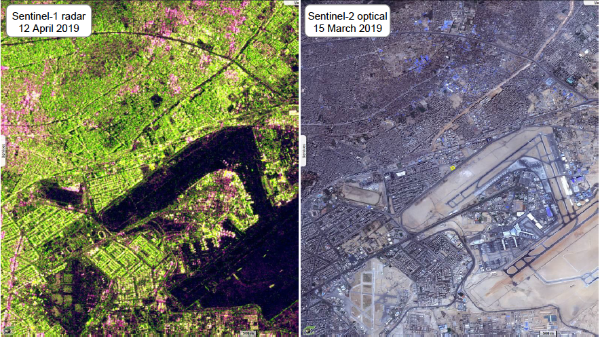
La polarisation VV de Sentinel-1 offre une meilleure vue de la surface de la mer. Ces tâches sombres peuvent être les témoins de pollutions d’origine humaine (oil spills) causés par le déballastage des navires, des fuites des plateformes pétrolières ou bien les émanations naturelles de réservoirs sous-terrain (oil seepages).
Dans sa partie maritime, on note aussi des bruits du signal qu’on observe fréquemment dans cette région et qui sont probablement dus aux activités militaires.
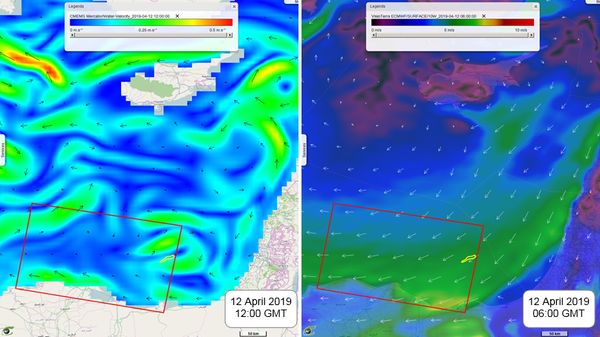
En couplant ces observations avec les données des services Copernicus, on peut prévoir la dérive des nappes en utilisant les courants de surface (CMEMS) et les vents de surface (ECMWF). Ces données sont issues de modèles globaux ou régionaux et sont délivrés chaque jour (données maritimes) ou plusieurs fois par jour (données atmosphériques).
The VV polarization of the Sentinel-1 images was chosen in particular to easily observe the oil slicks on the sea surface. These slicks can be witnesses of anthropogenic pollutions (oil spills) caused by deballasting of ships or leakage of oil rigs, or natural remains of the submarine tanks (oil seepages).
In the maritime part, we can also notice a signal noise that is frequent in this region and probably due to military activities.
Coupling with Copernicus service data allows the prediction of slick drift due to surface current (CMEMS) or surface winds (ECMWF). These data come from models producing global or regional maps once a day (maritime data) or several times a day (atmospheric data).
Fig.3: Oil spill observé le 12 avril 2019 à 03:51:30 GMT (c.à.d. 05:51:30 heure locale) + courants (cyan) + vents (jaune). vue_2D Fig.3: Oil spill observed on 12 April 2019 on 03:51:30 GMT (i.e. 05:51:30 local time) + currents (cyan) + winds (yellow). 2D_view
Fig.4: Vitesse des eaux de surface CMEMS (gauche) et vents de surface ECMWF (droite). 2D_gauche2D_droite Fig.4: CMEMS surface water velocity (left) and ECMWF surface winds (right). 2D_left2D_right
FLEGT Watch
Formation à Kumasi
et mission de terrain à Tetrem (Ghana)
FLEGT Watch
Training in Kumasi
and field mission in Tetrem (Ghana) 2D_layer_stack
Analyse des aires surveillées
Analysis of the monitored areas
Une formation « FLEGT Watch » s’est tenue du 8 au 11 avril 2019 à Kumasi (Ghana). Les objectifs de la formation étaient de :
Accéder aux événements détectés automatiquement dans les images radar Sentinel-1.
Photo-interpréter et évaluer ces détections en se servant d’autres données contemporaines (images optiques Sentinel-2 et précipitations).
Organiser une mission de terrain pour vérifier in-situ les événements détectés par satellites.
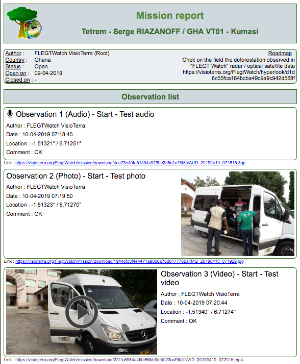
Partager les conclusions de cette mission sous la forme d’un rapport de mission.
Proposer des améliorations de l’application « FLEGT Watch ».
A FLEGT Watch training session was held from 8 to 11 April 2019 in Kumasi, Ghana. The objectives of the training were:
Access events detected automatically in Sentinel-1 radar images.
Photo-interpret and evaluate these detections using other contemporary data (Sentinel-2 optical images and precipitations).
Organize a field mission to verify in-situ the events detected by satellites.
Share the findings of this mission in the form of a mission report.
Propose enhancements to the "FLEGT Watch" application.
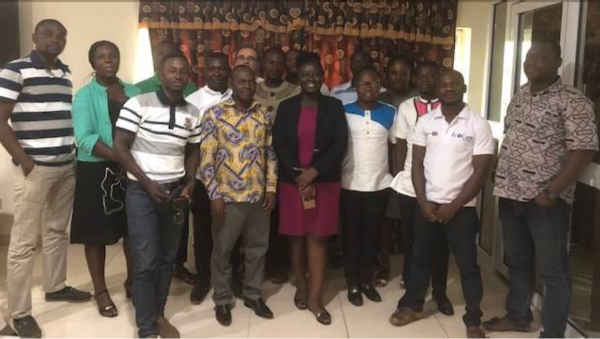
Fig.1: Participants de la formation « FLEGT Watch » à Kumasi. Fig.1: Participants of the « FLEGT Watch » training in Kumasi.
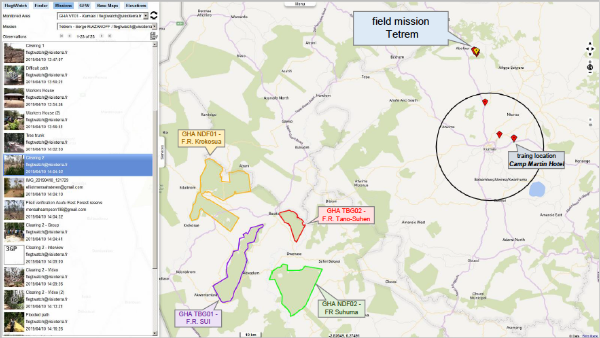
Fig.2: Service «Missions» - Localisation des aires surveillées (polygones de couleur), lieux de formation et de la mission de terrain. Fig.2: «Missions» service - Location of the monitored areas (coloured polygons), training and field mission locations.
Photo-interprétation des images Sentinel-1 (radar),
Sentinel-2 (optique)
Photo-interpretation of images Sentinel-1 (radar),
Sentinel-2 (optical)
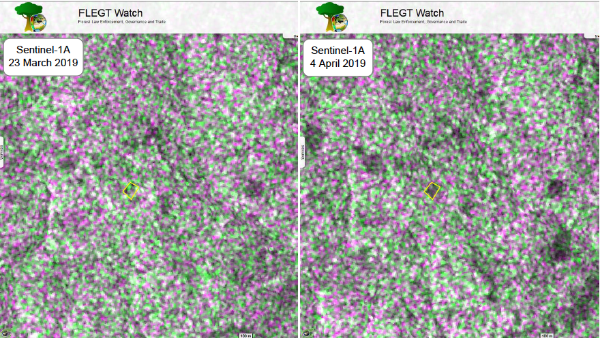
Outre les 4 aires surveillées de manière continue (voir fig.2) une recherche des changements de couvert forestier intervenus récemment a été opérée autour de la ville de Kumasi. Cette analyse est réalisée en comparant la dernière acquisition de Sentinel-1 (radar) avec l’observation au temps de cycle précédent (12 jours). La fig.3 illustre les différences entre les deux observations. On notera le caractère accidenté du terrain qui nécessite une orthorectification précise des images radar telle que pratiquée dans « FLEGT Watch ».
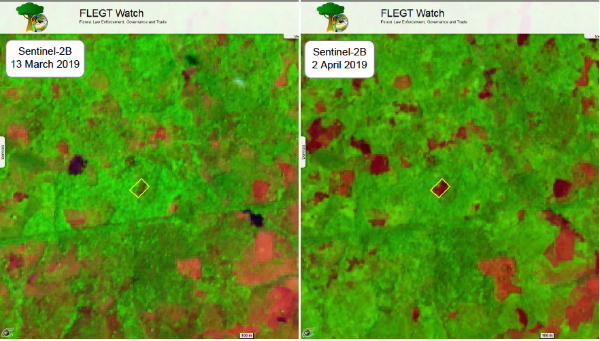
Une vérification est opérée en recherchant des images Sentinel-2 (optique) récentes dépourvues de nuages sur la zone. La fig.4 montre les compositions colorées moyen-infrarouge, proche-infrarouge, bleu (bandes 11,8,2).
Le polygone tracé en jaune situé dans cette forêt centrée sur la ville de Tetrem a été sélectionné comme cible de la mission de terrain.
In addition to the 4 continuously monitored areas (see Fig. 2), a search for recent forest cover changes has been carried out around the city of Kumasi. This analysis is performed by comparing the latest acquisition of Sentinel 1 (radar) with observation at the previous cycle time (12 days). Fig.3 illustrates the differences between the two observations. Note the rugged terrain that requires precise orthorectification of radar images as performed in "FLEGT Watch".
A check is made by searching for recent Sentinel-2 (optical) images that have no clouds on the area. Fig.4 shows the medium-infrared, near-infrared, blue colour composition (bands 11,8,2).
The yellow polygon in this forest centred on the town of Tetrem was selected as the target of the field mission.
Les opinions exprimées dans ce document reflètent uniquement les résultats des travaux et l'opinion de VisioTerra.
The views expressed herein reflect solely the results of the works and the opinion of VisioTerra.