Geoservices
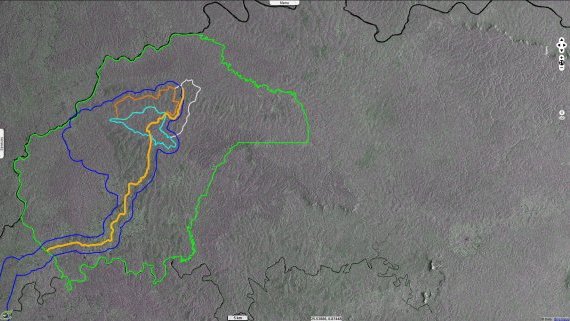
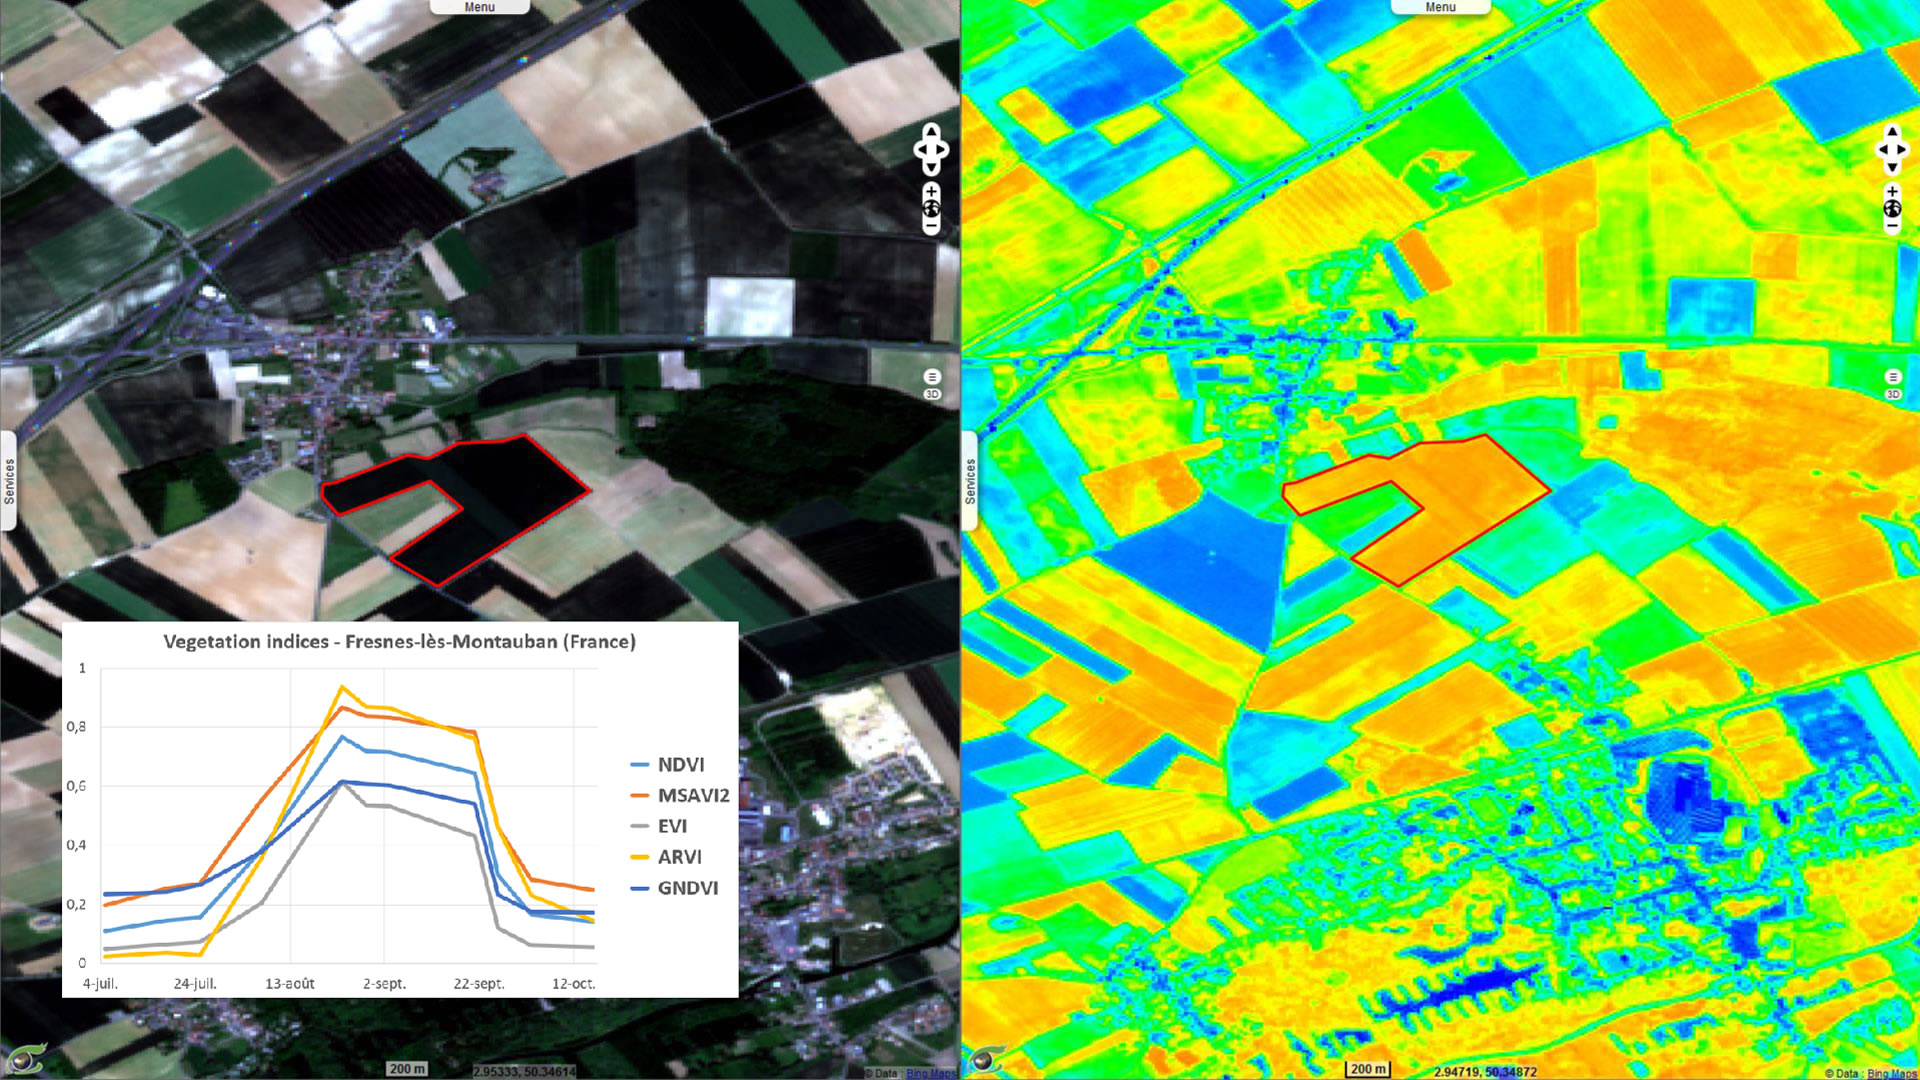
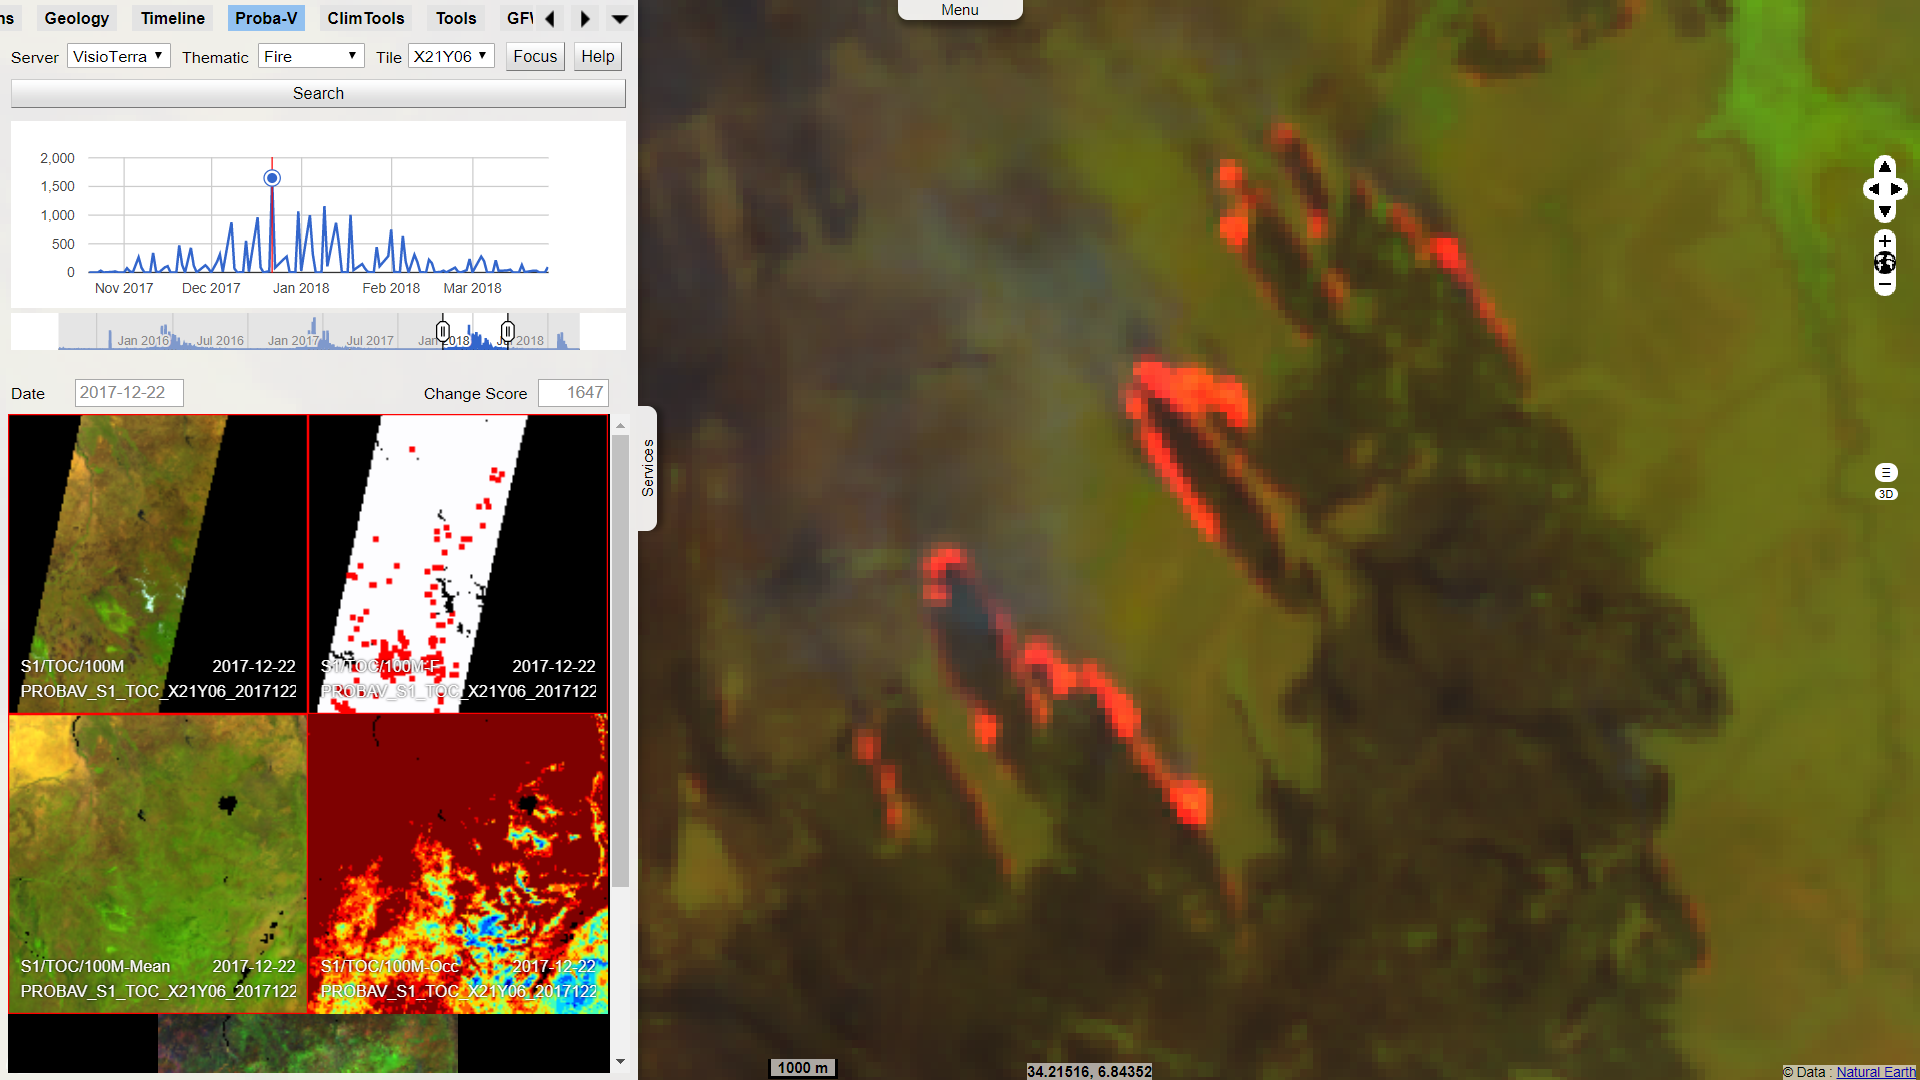
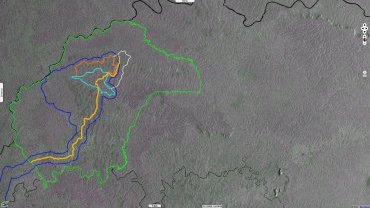
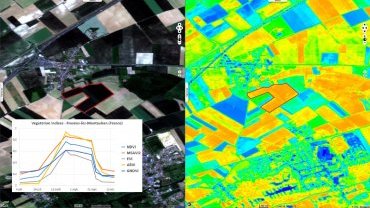
Geoservices provide users with synthetic information on the status of one or more indicators in a study area. Geoservices drive recurrent monitoring on user-defined areas of interest (zones to be monitored) by calculating one or more indicators each time the satellites fly over the area. Dashboards describe the evolution over time of the indicators (spatial aggregation graph) or the distribution of the values of an indicator in the study area (temporal aggregation map).
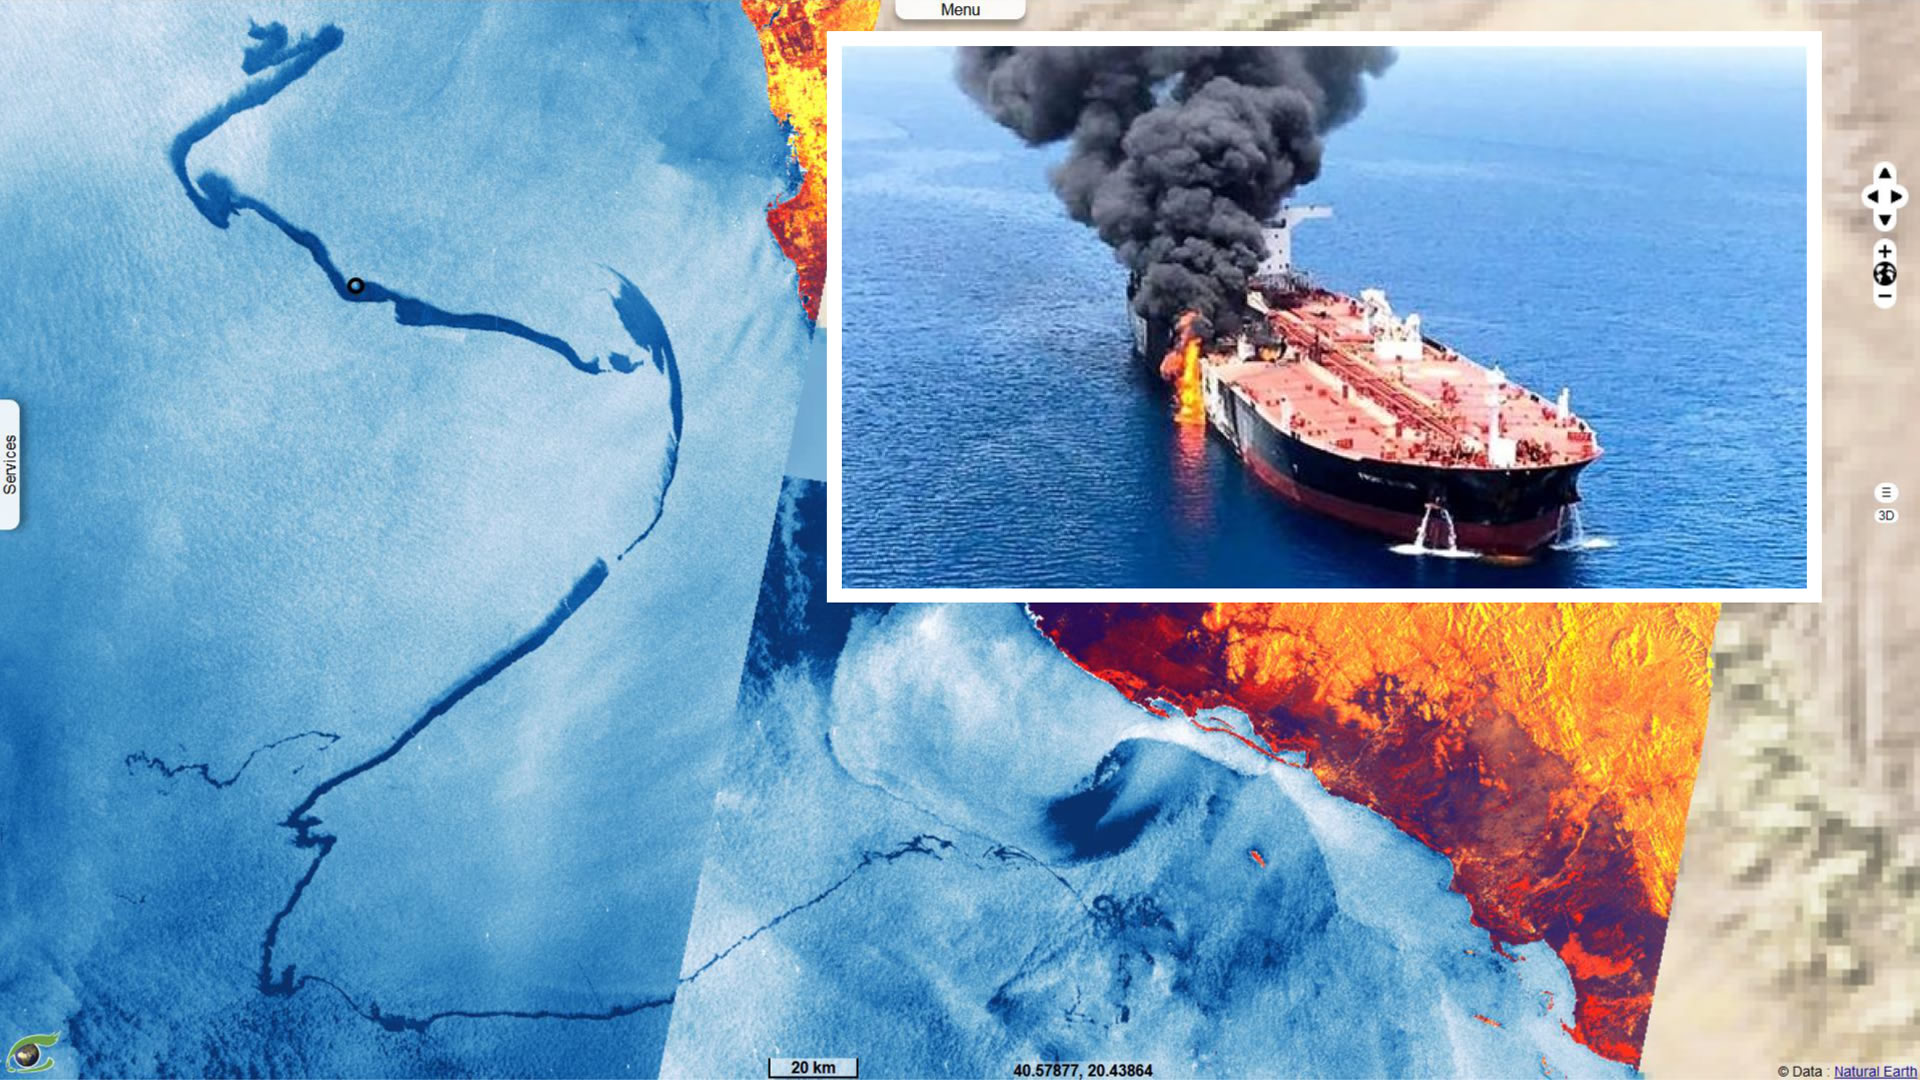
When a geoservice is active, alerts can be sent to users attached to the area to be monitored. This alert is sent whenever the value of the indicator exceeds the nominal values. A hyperlook accompanies the alert, allowing users to assess the relevance and urgency of the event.
VisioTerra’s experts accompany the users of a geoservice to train them in the photo-interpretation of events. A support service can also be offered to filter the automatically detected events.
According to a periodicity chosen by the user (monthly, quarterly, semi-annually...), a report service summarizes the activity in terms of satellite observations, value of the indicator(s), and even the frequency of alerts. This service allows to detect the most active periods and areas.